Covid-19 infection for San Francisco Bay Area
Objectives
1) Using only community death rates data and Decision Machine, learn the daily disease source strength and infection rate from the observed death toll.
2) Based on factual evidence, prove that public health policy and the response of citizens is helping to decrease the infection rate.
3) Alert health officials and the public to changes in the infection rate curve especially as it flattens and ultimately bends downward.
4) Monitor infection rate for any resurgence.
5) Report a top for the infection rate curve.
6) Measure the infection rate response as public health policy changes, therapies are introduced, we return to work, and our daily lives look familiar again.
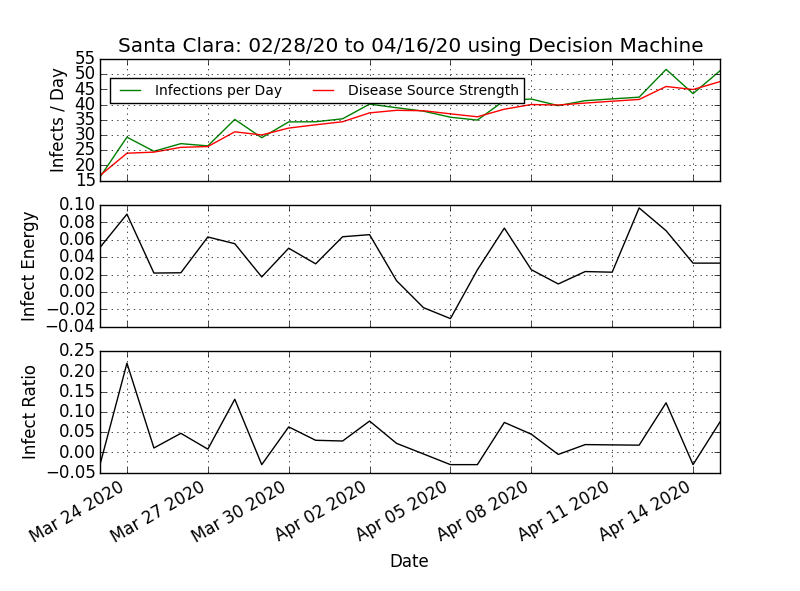
Covid-19 Geiger Counter machine learned source strength and infection are based on 3% mortality. We use the deaths data from The New York Times, based on reports from state and local health agencies. Plots use the date when the data was made publicly available.
Analysis and Plots